Mastering Strategy Building
Watch our tutorials and demos to see how QuantBacktest can help you build and validate winning strategies.
QuantBacktest Demo
Learn more about quantbacktest demo in this short demo video.
QuantBacktest AI Backtest Demo
Learn more about quantbacktest ai backtest demo in this short demo video.
QuantBacktest Dashboard Demo
Learn more about quantbacktest dashboard demo in this short demo video.
QuantBacktest Watchlist Page
Learn more about quantbacktest watchlist page in this short demo video.
Quant SAVE to Dashboard from Backtest Page
Learn more about quant save to dashboard from backtest page in this short demo video.
Advance Backtesting Strategy
Learn more about advance backtesting strategy in this short demo video.
📈What is Technical Analysis?
Technical analysis is a trading discipline employed to evaluate investments and identify trading opportunities by analyzing statistical trends gathered from trading activity, such as price movement and volume.
Unlike fundamental analysis, which attempts to evaluate a security's value based on business results such as sales and earnings, technical analysis focuses on the study of price and volume.
Key Concepts
- 1Price ActionThe belief that price discounts everything. All known info is reflected in the price.
- 2TrendsPrices move in trends (Up, Down, Sideways). Identifying the trend is step one.
- 3History RepeatsChart patterns reflect market psychology, which tends to be repetitive.
Why it matters?
"Technical analysis provides a framework for traders to understand market sentiment and make objective decisions based on data, rather than catching falling knives based on gut feelings."
Famous Indicators
Master these essential tools used by professional traders worldwide to analyze market trends and momentum.
Simple Moving Average (SMA)
Calculates the average price over a specific period. Helps identify the direction of the trend.
Relative Strength Index (RSI)
Measures the speed and change of price movements. Values > 70 indicate overbought, < 30 indicate oversold.
MACD
Moving Average Convergence Divergence. Shows the relationship between two moving averages of a security’s price.
Bollinger Bands
Consists of a middle band (SMA) and two outer bands. Used to measure market volatility and identify overextended prices.
Exponential Moving Average
Similar to SMA but places greater weight and significance on the most recent data points.
Volume
The number of shares or contracts traded in a security or an entire market during a given period.
🔁What is Backtesting?
Backtesting is the process of testing a trading strategy on relevant historical data to ensure its viability before risking any actual capital.
In simple terms:
"If I had followed this rule for the last 5 years, how much money would I have made?"
Golden Rules
- ✓Be Realistic: Include transaction costs and slippage in your simulation.
- ✓Avoid Overfitting: Don't tweak your rules just to make the past look perfect. Aim for robust logic that works across different market conditions.
- ✓Sample Size: Test over a long enough period (bull and bear markets) to be statistically significant.
How to use QuantBacktest?
Select Your Asset
Choose from US Stocks, Indian Stocks (NSE/BSE), or Global Markets. You can search by symbol or company name.
Choose Indicators
Browse our library of 100+ technical indicators. Click to add them to your strategy. You can mix moving averages, oscillators, price action, and more.
Set Parameters
Customize the settings for each indicator. Define your Buy (Entry) and Sell (Exit) conditions using simple logic (e.g., 'RSI < 30').
Run Backtest
Click 'Run Backtest' to simulate your strategy on historical data. Our engine processes years of data in seconds.
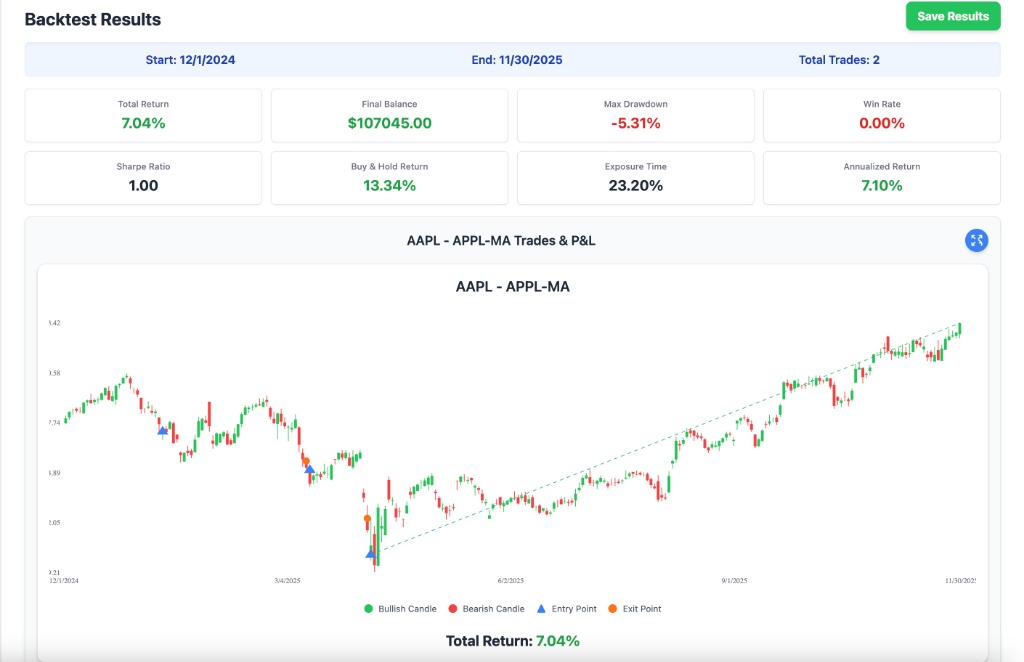
Analyze Results
Review detailed performance metrics like Total Return, Win Rate, Max Drawdown, and Sharpe Ratio to validate your edge.