Global Market Coverage
Backtest strategies across major international markets.
Limitless Possibilities
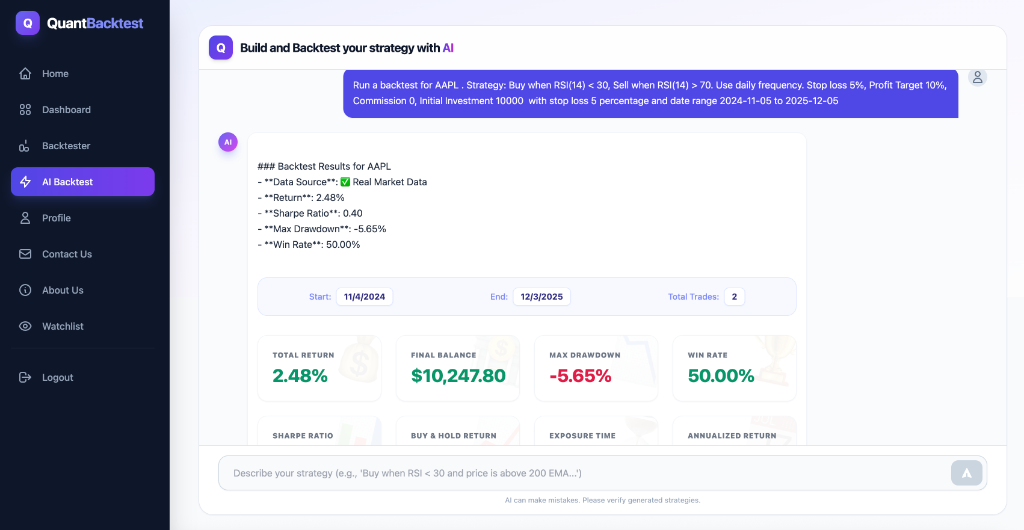
Build Strategies with AI
No coding required. Simply describe your trading ideas in plain English, and let our advanced AI generate the code, optimize parameters, and backtest it for you instantly.
- ✓Natural Language Strategy Creation
- ✓Automatic Code Generation
- ✓Instant Performance Validation
- ✓Optimization Suggestions
Efficiency First
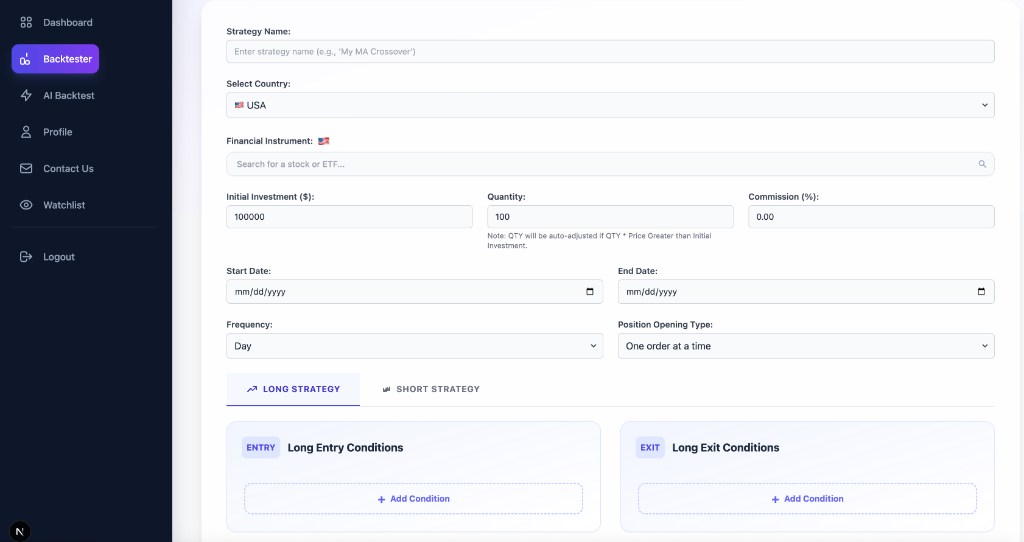
No Coding. Just Few Clicks.
Backtesting shouldn't be reserved for programmers. Our intuitive interface allows you to build sophisticated strategies in seconds. Simply select your indicators, set your parameters, and get instant results.
- ✓Visual Strategy Builder
- ✓Zero Programming Knowledge Needed
- ✓Instant Indicator Integration
- ✓User-Friendly Dashboard
Advanced Intelligence
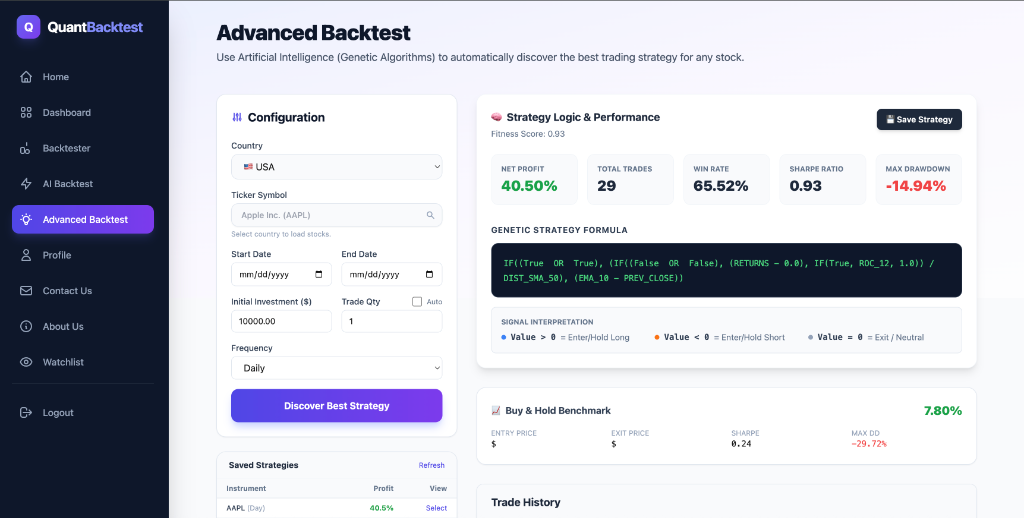
Discover Best Strategy Automatically.
Use Artificial Intelligence (Genetic Algorithms) to automatically discover the best trading strategy for any stock. Our engine evolves profitable strategies by combining indicators and optimizing parameters for you.
- ✓Evolutionary Strategy Discovery
- ✓Maximize Sharpe Ratio or Profit
- ✓Automated Parameter Tuning
- ✓Bias-Free Algorithm
Powerful Features
Everything you need to build, test, and refine your trading strategies.
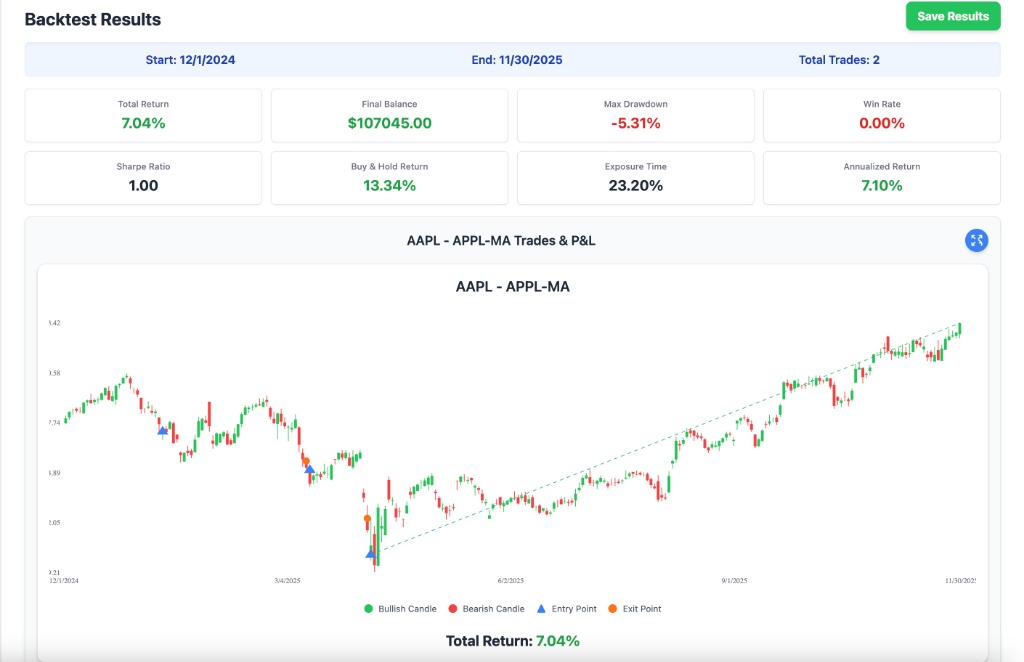
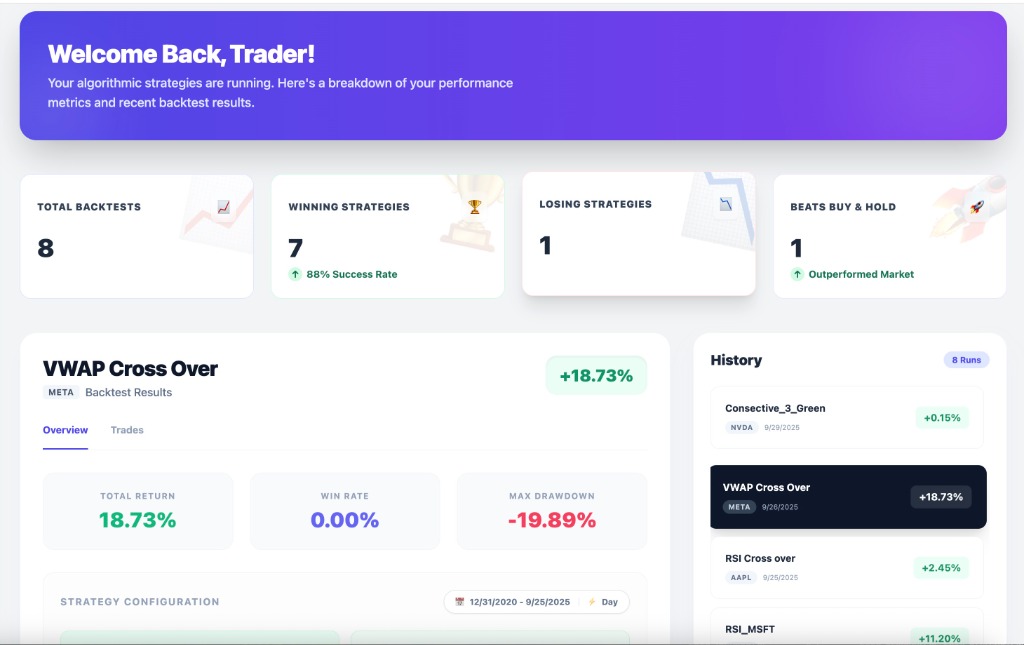
Deep Visual Insights
Don't just see the numbers. Visualize your strategy's performance with interactive charts. Spot entry and exit points directly on the price action to understand exactly why a trade was taken.
- ✓Interactive Candlestick Charts
- ✓Trade Markers on Chart
- ✓Zoom & Pan Capabilities
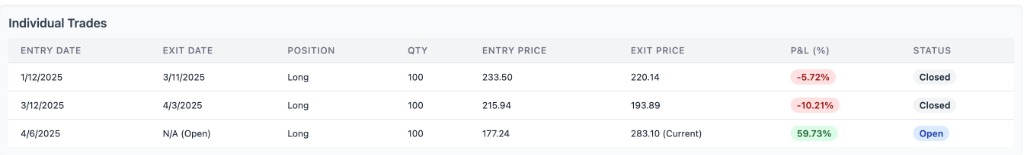
Granular Trade Analysis
Drill down into every single trade. Analyze your winners and losers to refine your edge. Our detailed trade logs provide transparency into your strategy's execution.
- ✓Entry & Exit Prices
- ✓Profit/Loss per Trade
- ✓Trade Duration Analysis
Comprehensive Indicator Library
Mix and match indicators from multiple categories to build complex, multi-layered trading strategies.
Technical Indicators
- Simple Moving Average (SMA)
- Exponential Moving Average (EMA)
- MACD
- VWAP
- RSI
- Stochastic Oscillator
- CCI
- Bollinger Bands
- ATR
- More..
Custom Indicators
- Higher High / Lower Low
- Prev Higher High / Low
- Consecutive Candle
- Fibonacci Retracement
- Breakout & Retest
- More..
Price Indicators
- Price (O,H,L,C)
- Prev Day / Week (O,H,L,C)
- 52W / All Time High & Low
- Gap Up / Down
- Price Up/Down %
- Drop / Rise %
- More..
Volume Indicators
- Current Volume
- Average Volume
- Pre-market Volume
- Previous Day Volume
- On-Balance Volume (OBV)
- More..
Time Indicators
- Time After Open (Hrs/Mins)
- At Specific Time
- Market Open / Close
- More..
Candlestick Patterns
- Doji / Marubozu
- Hammer / Inverted Hammer
- Bullish / Bearish Engulfing
- Shooting Star / Hanging Man
- More..
Chart Patterns
- Double Top & Bottom
- Head and Shoulders
- Inverse Head and Shoulders
- More..